10x: Logging at Clay.io
![]()
Managing 20+ servers as a small team is no easy task, and when things go wrong (they always do) figuring out what happened quickly is essential. Of course we can't ssh into each machine, that would take ages, so instead we use Logstash to aggregate our logs.
This is the second post in my 10x series, and if you missed last episode: Architecture at Clay.io.
Logstash overview
Logstash deployments have two parts. The aggregate server (or cluster), and the
client servers. The aggregate server runs the main logstash binary, while the
client servers run logstash-forwarder to ships logs to the logstash instance.
Here is a diagram of our setup:
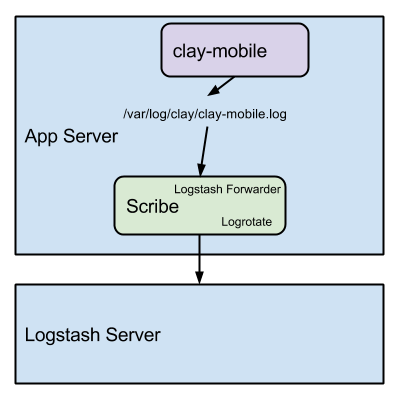
Note that logstash-forwarder doesn't rotate logs. Log rotation is the process of
storing older logs (usually compressed) into buckets (either of size or by date)
and then eventually expiring them. The (aptly named) tool for the job here is
the logrotate linux utility.
Investigating logs
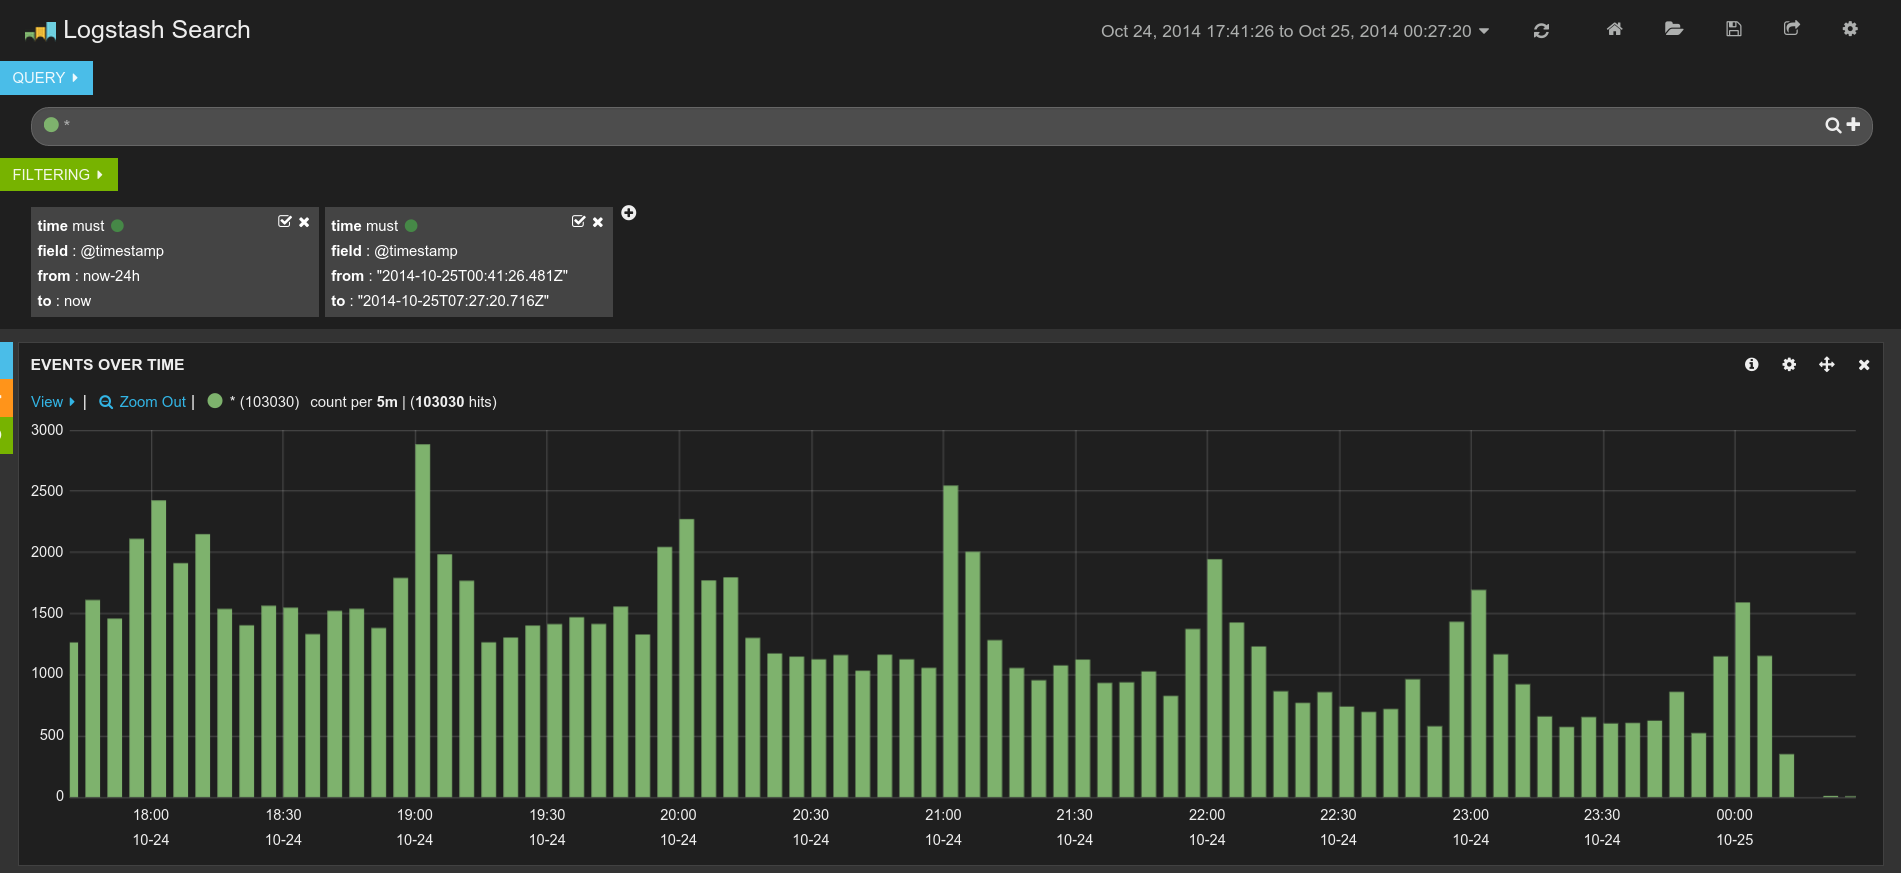
The logstash daemon runs ElasticSearch and Kibana to analyze logs. You can apply many filters and create complex queries into your log data this way because of ElasticSearch.
Note that you cannot expose ElasticSearch ports publicly or your server will get hacked (!). This happened to us, and our solution was to move our infrastructure to Amazon VPC so that the only way to get to the logs is to be inside of our privileged network.
Journalist + Scribe
At Clay.io we have open-sourced our Docker containers so that anyone can deploy a distributed logging system themselves in just a few seconds.
Logstash Server: clay/journalist-public
Logstash-forwarder Server: clay/scribe-public
Good Luck!